
SMA Market Report
SanMigueldeAllendeRealEstateMarketReport:August2026
12 sales and 33 new listings, yet prices held: August was quiet but steady in San Miguel de Allende.
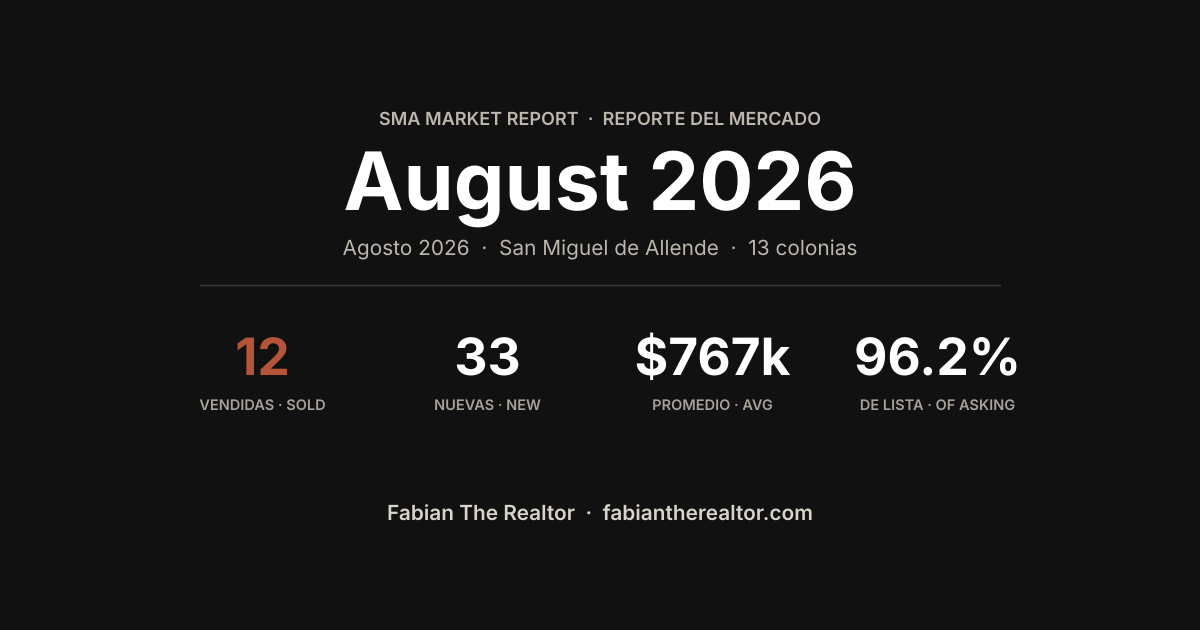
August was the quietest month of the year along with January, both in new listings and in sales.
The month at a glance
Homes and lots sold: 12 (all homes, no lots)
New listings: 33 (25 homes and 8 lots)
Sale price vs. asking price: the typical sale closed at 96.2% of asking (3.8% discount)
Average price: $767k · Highest sale: $1.74M
Days on market: 243
Buyers: 92% American and 8% Mexican
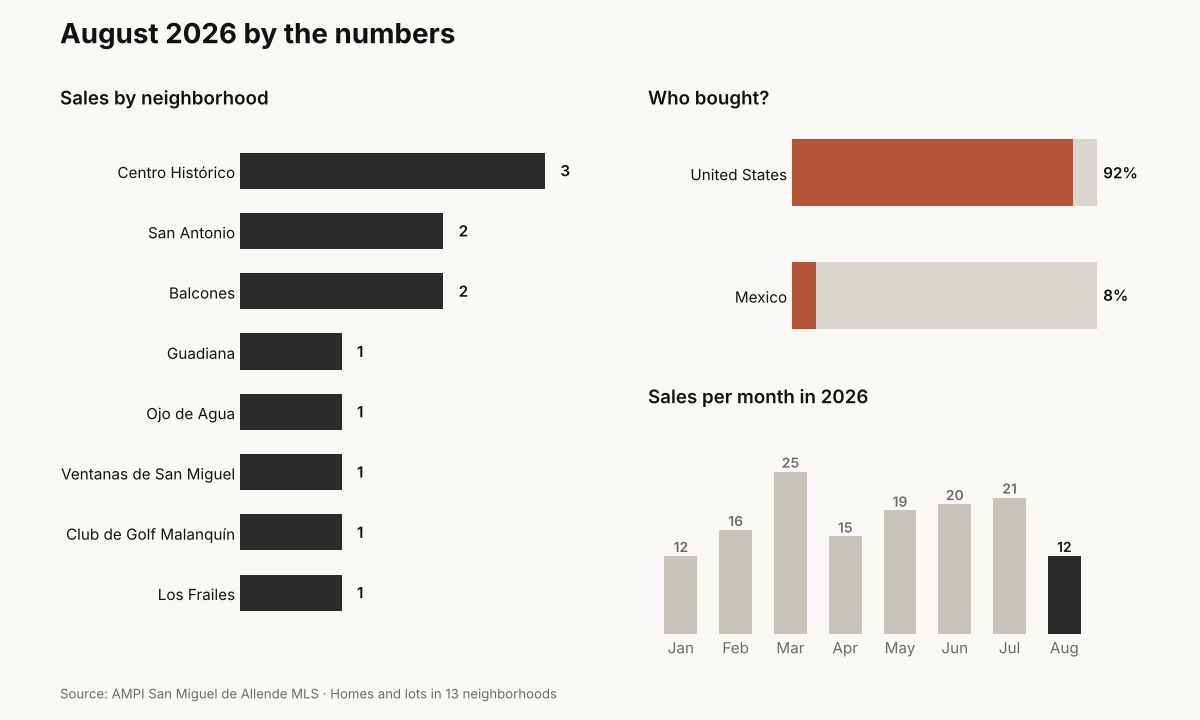
By neighborhood
Neighborhood | Sales | Average price | Highest sale | Days on market |
|---|---|---|---|---|
3 | $664k | $1.74M | 320 | |
2 | $547k | $750k | 211 | |
2 | $885k | $1.04M | 261 | |
1 | $1.29M | $1.29M | 45 | |
1 | $1.05M | $1.05M | 85 | |
1 | $852k | $852k | 197 | |
1 | $770k | $770k | 399 | |
1 | $379k | $379k | 290 | |
All 13 neighborhoods | 12 | $767k | $1.74M | 243 |
Prices in US dollars. Neighborhoods not listed had no sales this month.
My take
Less new inventory and fewer closings, but prices held: the discount stayed under 4%. Sellers in August didn't have to give their homes away.
About this data
These numbers cover 13 San Miguel de Allende neighborhoods: Centro Histórico, San Antonio, Guadiana, Ojo de Agua, Guadalupe, Atascadero, Balcones, Obraje, Ventanas de San Miguel, Club de Golf Malanquín, Independencia, Los Frailes, Viñedos. They include only homes and lots for sale. The discount is the typical (median) gap between asking price and sale price for the month. Source: AMPI San Miguel de Allende MLS.
If you're thinking about buying or selling in San Miguel de Allende, email me at [email protected] and we'll go over the numbers for your neighborhood.